The Quintessence of Quadratics
Introduction
We began our experience with quadratics by solving basic kinematic problems like acceleration. We used desmos as a tool to visualize the shape, size, and location of the parabolas. The objective of the project was to understand quadratic functions and to understand how to use what we learned to solve quadratic equations. The main point of the project was around a problem in witch a rocket was being launched for a firework show.
We began our experience with quadratics by solving basic kinematic problems like acceleration. We used desmos as a tool to visualize the shape, size, and location of the parabolas. The objective of the project was to understand quadratic functions and to understand how to use what we learned to solve quadratic equations. The main point of the project was around a problem in witch a rocket was being launched for a firework show.
Vertex Form of a Quadratic Equation:
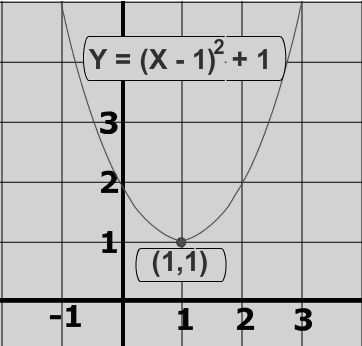
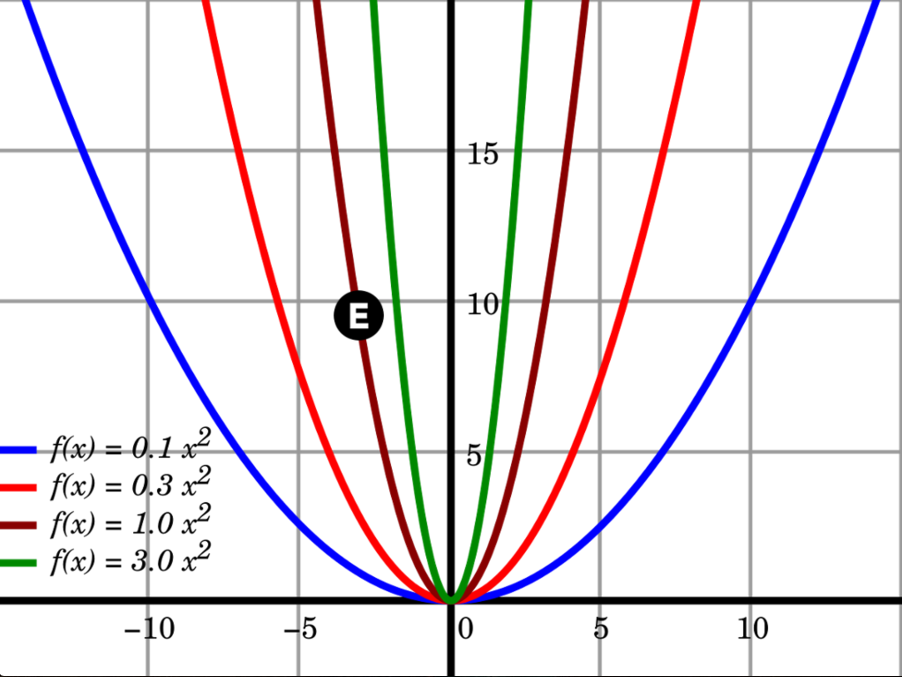
The vertex form of a Quadratic Equation looks like f (x) = a(x - h)2 + k. I was relatively confused when I first saw problems like this, but after breaking it down I understood. A parabola changes when the a, h, and k values are altered, and that lets us view what they were previously and the effect they have on the parabola. When I figured out that A is the curve of the parabola and H is the opposite of X and that K is equal to the Y value I completely understood the problem
The vertex form of a Quadratic Equation looks like f (x) = a(x - h)2 + k. I was relatively confused when I first saw problems like this, but after breaking it down I understood. A parabola changes when the a, h, and k values are altered, and that lets us view what they were previously and the effect they have on the parabola. When I figured out that A is the curve of the parabola and H is the opposite of X and that K is equal to the Y value I completely understood the problem
Other forms of the Quadratic equation
Next we completed a set of problems that introduced us to standard form and factored form. The Standard form is when the A, B, and C in the equation can be any value.Because of this, it becomes easy to identify the y- intercept of the same parabola. Standard form is similar to vertex form and essentially the only thing you replace is the A,K, and H variable with A, B, and C: Y=Ax^2+Bx+C. With the factored form, it is basically an extension of standard form, witch makes it easy to see the x-intercepts of the parabola: Y=A(x-B)(x-C).
Next we completed a set of problems that introduced us to standard form and factored form. The Standard form is when the A, B, and C in the equation can be any value.Because of this, it becomes easy to identify the y- intercept of the same parabola. Standard form is similar to vertex form and essentially the only thing you replace is the A,K, and H variable with A, B, and C: Y=Ax^2+Bx+C. With the factored form, it is basically an extension of standard form, witch makes it easy to see the x-intercepts of the parabola: Y=A(x-B)(x-C).
Converting Between Forms
Here are some examples of converting between forms
Here are some examples of converting between forms
How an area diagram can help you understand the distribution of multiplication over addition
An area diagram can help you solve quadratic equations because it provides a visual representation witch can really help you grasp the physical concept. It is easy to see specifically where each variable goes and makes the step by step process simple. When the square becomes completely filled in, You can break down the process an solve the problem.
An area diagram can help you solve quadratic equations because it provides a visual representation witch can really help you grasp the physical concept. It is easy to see specifically where each variable goes and makes the step by step process simple. When the square becomes completely filled in, You can break down the process an solve the problem.
Solving problems with quadratic equations
There are three diffrent types of real life problems that can be solved with quadratics. They are Kinematics, Economics, and Geometry.
Kinematics was well suited for the Another Rocket handout, because it involved finding a length, distance, and trajectory. The Geometry portion related most to our Leslies Flowers problem because the gardner was working with rectangular garden boxes and she had to measure length, width, and height. Finally the Economics section related most to the Widgets problem because it involved dividing up a circle evenly and accounting for each piece.
Reflection
I found this project to be difficult but satisfying. The parabolas problems we solved using desmos was not extremely difficult but still presented me with a challenge. Quadratics as a whole was very difficult for me to understand from the beginning and I often found myself falling behind as the problems increased in difficulty. After a few bumps and talking with Dr. Drew and my peers I finally understood quadratics at a level I was comfortable with.
The Habits of Mathematician I used during this project:
Start Small: Before going into all of the equations given, I tried to get to know the program before and begin with small equations before moving into the packet.
Look for patterns: I used this habit for various problems were extremely difficult. I attempted to make the problems simpler and easier for me to understand and solve.
Be Systematic: This problem helped me mainly with the corral variation problems. This problem was extremely difficult, but using this habit helped me to better understand and ultimately complete and solve the problem.
Take apart and Put back together: I used this habit the most on parabolas. When I was using Desmos, I had to look for patterns in order to find the correct vertex form.
Seek Why and Prove: I asked a lot of questions about almost every new concept. This ultimately helped me in the end.
Conjecture and Test: As well as asking questions I also made conjectures even if I was shure the answer was correct.
Stay Organized: Staying organized helped me when I needed to revisit notes or take a photo of an old worksheet.
Describe and Articulate: This habit is the process of drawing visuals on paper and in desmos. I used this mainly with parabolas. I drew out a lot of graphs and area diagrams over the course of this project.
Be Confident, Patient, and Persistent: I have had trouble in the past staying confident when I kept getting problems incorrect. But this time I stayed patient and persistent and acheived my goal.
Collaborate and Listen: It really helped to listen to my group members when I was having trouble understanding, and I may have even helped when I collaborated and gave feedback on there answers.
Generalize: I used this habit mainly when we were learning about vertex form. I made educated guesses on many answers and checked with my peers to make sure my answers were actually correct.
Measure Your World
Description and Overview:
This semester we covered a lot things that had to do with measurement. Together as a class, we started Learning how to measure simple distances using triangles that lead to distance formula. With distance formula we began to explore what shapes would look like if they all had the same distance to a center point. this was the Pythagorean theorem. Then we transitioned to points on the x and y axis, Intersections with radial lines, and how or what angles are formed. From there we learned about the sine and cosine of triangles. The Sine is the ratio of the hypotenuse and sides of triangles. The Cosine is the ratio of the adjacent and hypotenuse sides of triangles. We learned how to apply these terms to the Pythagorean Theorem and the distance formula. By learning all this, we were able to start proving that a tangent of an angle is equivalent to sin/cos. Starting with 30, 45, 60 degree angles. In the final trigonometry portion, we were given a problem about how the British calculated the height and position of Mount Everest using a theodolite. Using the Habit of a Mathematician "starting small" we were able to learn and understand how trigonometry played into this. Learning how a square can be split into right triangles. Leading into further exploration of using trigonometry to find areas of equilateral and isosceles triangles. Which helped us create formulas for pentagons, hexagons, and octagons. lastly, we learned about volume in 3d shapes and learning how to calculate the area and volume within shapes like rectangular prisms and cylinders.
Create Your Own Project:
For the create your own project portion of the measurement project we had to choose any object we wanted and measure it in any way we wanted. I choose to measure the surface area of my personal laptop. I choose to measure my laptop because it is important to me and I use it almost every day.
Habits of a Mathematician:
I believe I used the habit of a mathematician "be systematic" because I spent a lot of time making very small tweaks and adjustments to my formula. This really helped me understand the formula in a diffrent way witch ultimately helped me solve the problem. I was also systematic when measuring the laptop. Since I do not own digital calipers, I decided to measure the laptop and then cut a slot that was the same size as my measurement into a piece of cardboard just to make sure that I was getting a accurate measurement. It took some practice to figure out this method but it ultimately helped me a lot.
I believe I used the habit of a mathematician "be systematic" because I spent a lot of time making very small tweaks and adjustments to my formula. This really helped me understand the formula in a diffrent way witch ultimately helped me solve the problem. I was also systematic when measuring the laptop. Since I do not own digital calipers, I decided to measure the laptop and then cut a slot that was the same size as my measurement into a piece of cardboard just to make sure that I was getting a accurate measurement. It took some practice to figure out this method but it ultimately helped me a lot.
Overall Reflection:
During this unit of math I felt like I learned a lot. I felt like I really absorbed a lot of information ad it helped me grow as a learner. I had some trouble at first getting all of my formulas correct but eventually with the help of my peers I was able to get everything figured out. I also had a little trouble at first when I was deciding what I was going to measure. Eventually I decided on my laptop but I felt a little bit rushed because it took me a while to decide what I wanted to measure It didn't end up really mattering in the end but it would have been nice if I had more time. I really enjoyed the freedom we had during his project and the fact that we were able to choose what method we wanted to use to solve the problem. I look forward to more projects like this in the future
During this unit of math I felt like I learned a lot. I felt like I really absorbed a lot of information ad it helped me grow as a learner. I had some trouble at first getting all of my formulas correct but eventually with the help of my peers I was able to get everything figured out. I also had a little trouble at first when I was deciding what I was going to measure. Eventually I decided on my laptop but I felt a little bit rushed because it took me a while to decide what I wanted to measure It didn't end up really mattering in the end but it would have been nice if I had more time. I really enjoyed the freedom we had during his project and the fact that we were able to choose what method we wanted to use to solve the problem. I look forward to more projects like this in the future
Programming and Probability
Project description: , During this project we learned about many different parts of probability and created online video games which we later presented at exhibition. Each group chose a different type of game, and created it using probability as the main feature.
Overview: During this project we explored the basics of programming by programming our own game and presenting our work at our exhibition. We created two way tables to compare and contrast probability with whoever was listening. We worked with star logo nova, an online programming site we used to create interactive games that incorporated probability into its code and structure.Then we began to think more about probability and do problems like "the dog ate my homework", where we were given a data set and were told to make a two way table and figure out the probabilities that can come out of said table. Finally, we analyzed the probability of a real world problem: what is the probability that women who test negative for breast cancer actually have cancer?
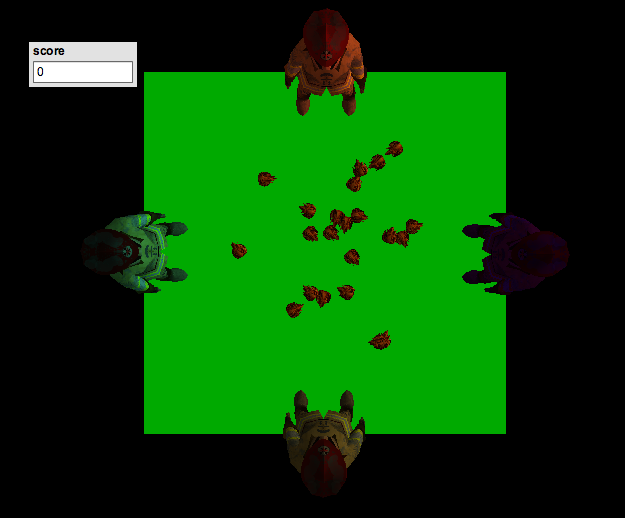
Game instructions: My game is a twist on the game hungry hungry hippos. In my version of the game, The hippos are firefighters putting out fires. But you must be aware of the purple flames. If you attempt to put out the purple flames, then you will lose 10 points. The probability is that there is a 75 precent chance a normal fire will spawn, and a 25 precent chance a purple flame will spawn. To begin playing my game, press the "setup" then "forever" then "food" buttons. After this, the flames should start spawning. Press the w,a,s,d keys to move the firefighters to put out the flames and earn points. But watch out for the purple flames because they will make you lose 10 points.
Overview: During this project we explored the basics of programming by programming our own game and presenting our work at our exhibition. We created two way tables to compare and contrast probability with whoever was listening. We worked with star logo nova, an online programming site we used to create interactive games that incorporated probability into its code and structure.Then we began to think more about probability and do problems like "the dog ate my homework", where we were given a data set and were told to make a two way table and figure out the probabilities that can come out of said table. Finally, we analyzed the probability of a real world problem: what is the probability that women who test negative for breast cancer actually have cancer?
Game instructions: My game is a twist on the game hungry hungry hippos. In my version of the game, The hippos are firefighters putting out fires. But you must be aware of the purple flames. If you attempt to put out the purple flames, then you will lose 10 points. The probability is that there is a 75 precent chance a normal fire will spawn, and a 25 precent chance a purple flame will spawn. To begin playing my game, press the "setup" then "forever" then "food" buttons. After this, the flames should start spawning. Press the w,a,s,d keys to move the firefighters to put out the flames and earn points. But watch out for the purple flames because they will make you lose 10 points.
Reflection: During our probability and programming project I feel I have gained many new skills. When I first started programming my game, I did not think that I could create a high quality game that met the criteria of my peers, due to the fact that I had very little programming experience, and very little confidence in myself. I began to realize that programming is not as scary as it seems and With that new found confidence I was able to create an awesome game. I feel like my exhibition presentation went well because many people said that they enjoyed my game because it was simple yet fun. I grew in the habit of a math mathematician of organization. This is because I was able to stay organized while making my game witch led me to have more time to improve minor details, thus making a better game. I look forward to creating more work that I can be proud of in the next semester.
Scaling your world
Project Description : In this project we used similarity and the geometric transformation dilation (also known as scaling, and colloquially referred to as “zooming in” or “zooming out”) were studied through modeling, exploration, and reasoning. Students will explore important ideas in geometry, and apply skills with functions and algebra. The primary context for this exploration is mathematical modeling and how geometry (specifically similarity and dilation) can be used to create physical models of real-world phenomena.
Purpose of the Project
This project had a lot of steps to it, but there were four main assignments that mattered for our final draft. We started the project by learning about different math concepts, but it ended with these four Benchmarks.
Benchmark #1; Deciding what to scale down or up.
In this benchmark, we had to decide what to scale up or down and what scale factor that will be. We had to write a paragraph to our teacher explaining who we will be working with, our object we are choosing to scale, the scale factor to which we are scaling, and how we are presenting it.
Benchmark #2; Math behind the work.
In this benchmark, we had to complete the math behind the work. We had to do all the math to scale up or down our object. At least three of the measurements had to be correct, but we were expected to try and get them all correct.
Benchmark #3; Final Draft.
In this benchmark, we had to create and turn in our finial draft. Some people made models of their exhibition piece, others made videos. It had to show what you chose to scale and the new version of that; bigger or smaller.
Benchmark #4; DP Update.
In this benchmark, we had to upload this DP update informing everyone of what we did for this project.
Mathematical Concepts
During this project we learned many different mathematical concepts, and the whole project was based on dilation and similarity.
Definition of Similarity;
Geometry. (of figures) having the same shape; having corresponding sides proportional and corresponding angles equal: similar triangles.
Definition of Proportion;
A proportion is a name we give to a statement that two ratios are equal. I
Definition of Dilation;
A dilation is a transformation (notation ) that produces an image that is the same shape as the original, but is a different size. A dilation stretches or shrinks the original figure. The description of a dilation includes the scale factor (or ratio) and the center of the dilation.
This relationship between similarity and proportion. For two shapes to be similar, all the angles have to be in proportion. The side lengths do not need to be the same, because they would not be the same, not similar. For something to be similar, the proportions all have to line up. Also, you use proportions to find if two shapes are similar. If you are doing a math problem, that involves finding a missing side in two shapes, looking for proportions will help you find out if the shapes are similar. Basically, when you use one, you always use the other.
The relationship between similarity and dilation are fairly simple. Similarity is the process of dilation. If you have one image that is bigger than the other, but with all mathematically similar sides, it is considered similar. One image is a dilation of the other image. They go together. If there are two image under dilation, they are similar.
Benchmark #2 and benchmark #3 also had a relationship that came together nicely. In benchmark 2 we did all the math that we needed for benchmark 3. We took the twenty foot giraffe and scaled it down to two feet. We had to then scale all the body parts down to match. To do this, we took each number, from the original image, and multiplied it by 1/10. Once we completed that section (benchmark 2) we used those exact measurements to make our giraffe in benchmark 3.
Exhibition
Benchmark #1; Deciding we will scale down a giraffe.
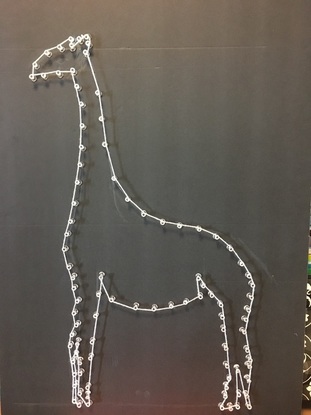
For this benchmark, we decided that we will scale a twenty foot giraffe down to two feet. We scaled it down by one tenth. We also had to chose how we will present this. We chose to present it on a poster board and we would make the to scale giraffe with push-pins and connect them with yarn.
Benchmark #2; Figuring out the measurements.
In this benchmark, we had to do the math and figure out how to accurately and correctly scale down a giraffe from twenty feet down to two. the first thing we had to figure out how long each part of the body was. The whole giraffe is two hundred forty inches. The legs are 96 inches, the body is 36 inches, the neck is 96 inches, and the head is 12 inches. We multiplied each number by 1/10 to get the size of the smaller giraffe. After we did that we got all our measurements; the whole giraffe is now 24 inches, legs are now 9.6 inches, body is 3.6 inches, neck is 9.6 inches, and the head is now 1.2 inches.
Benchmark #3; Final Draft.
In this last benchmark, we had to create our actual two foot giraffe. We started by drawing it out onto the poster board. After we drew all the body parts to scale, we used almost one hundred push-pins to outline the drawing. Then, we used yarn to connect them and finish our final exhibition draft.
Benchmark #1; Deciding we will scale down a giraffe.
For this benchmark, we decided that we will scale a twenty foot giraffe down to two feet. We scaled it down by one tenth. We also had to chose how we will present this. We chose to present it on a poster board and we would make the to scale giraffe with push-pins and connect them with yarn.
Benchmark #2; Figuring out the measurements.
In this benchmark, we had to do the math and figure out how to accurately and correctly scale down a giraffe from twenty feet down to two. the first thing we had to figure out how long each part of the body was. The whole giraffe is two hundred forty inches. The legs are 96 inches, the body is 36 inches, the neck is 96 inches, and the head is 12 inches. We multiplied each number by 1/10 to get the size of the smaller giraffe. After we did that we got all our measurements; the whole giraffe is now 24 inches, legs are now 9.6 inches, body is 3.6 inches, neck is 9.6 inches, and the head is now 1.2 inches.
Benchmark #3; Final Draft.
In this last benchmark, we had to create our actual two foot giraffe. We started by drawing it out onto the poster board. After we drew all the body parts to scale, we used almost one hundred push-pins to outline the drawing. Then, we used yarn to connect them and finish our final exhibition draft.
Reflection During this project I faced many successes and challenges. I faced challenges in areas such as deciding what to scale, how to scale it, and how to make it look professional. One challenge that really stuck out to was figuring out how to create our final draft. I think I could have thought the idea through at the very beginning of the project. First, we wanted to just draw our giraffe onto a poster board, but we didn't think it was professional enough. It took us multiple drafts to come up with our final idea, but we got therein the end. One success that I had was the math behind it. I felt very proud when we accomplished the math and it was all correct.
The Habits of a Mathematician came in handy for this project. I feel like I used "Collaborate and Listen" and "Be Confident, Patient, and Persistent". My partner and I had to collaborate and consider each others ideas to make many final decisions on our piece. I feel like I was confident, patient, and persistent during this project for a few reasons. I believe this because we had many drafts of our project, and it took lots of time to feel confident with the piece that we turned in.
This project taught me math skills and skills that I will use in next projects. My number one take away skill is to never give up.I realized that no matter how difficult a project gets you can always keep trying and make it better. I thought that we could not make our final draft look professional enough, but with endless amounts of effort it was possible. I will definitely use this skill in my next project because I now know that my project can always be improved.
Week of Inspirational Math
For the first weeks of math class we learned about many different types of brain growth through math. We learned this mainly through four problems that were not hard to solve, but had many different ways to get the answer. We also watched videos by stanford that focused on how the brain works when doing math. Each of these videos had a message but the two that stuck out to me was the one which talked about how making mistakes is valuable to growth and the one that said that speed doesn't matter while solving math problems. I have never considered myself that good at math or very fast. But after watching these videos I realized that speed dosen't matter as long as you get the right answer.
The first problem we did was we had to cover an 11x13 rectangle with the least possible amount of squares possible.
The second was Squares to Stairs in which we had to figure out the pattern in squares which would increase in a stair model each time.
The third was the Hailstone Sequence which was sequence of numbers which operated by two rules: If the number is even, it gets divided by 2 and if the number is odd it gets multiplied by 3 and 1 is added to it and we had to observe the pattern and deduce whatever we could.
The last was the Painted Cubes in which we imagined a 3x3x3 cube (made of smaller 1x1x1 cubes) being dunked in paint and then figured out how many cubes had 3 sides painted, how many had 2 sides painted, how many had 1 side painted, and how many had no sides painted. Below is a slideshow of my work.
Hailstone Sequence: Extension.
For my in-depth extension, I choose the hailstorm sequence because I actually enjoyed using it. The Hailstone Sequence which was sequence of numbers which operated by two rules: If the number is even, it gets divided by 2 and if the number is odd it gets multiplied by 3 and 1 is added to it and we had to observe the pattern and deduce whatever we could. I found It very interesting how the numbers bouncing up and down until they reach a never ending 1-0 pattern is just like how rain bounces in between clouds until it becomes heavy enough to fall to the ground. At first I really didn't understand the Hailstorm sequence but now I find it very intriguing and I even showed it to my parents who also thought it was really cool.
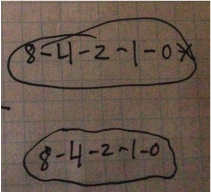
Another example would be: 7, 22, 11, 34, 17, 52, 26, 13, 40, 20, 10, 5, 16, 8, 4, 2, 1, 4, 2, 1,
Above is a simple hailstorm sequence starting with the number 8 and just going down because the numbers are all even. if a odd number would have come up It would probably have been a lot longer.
